Participants played the role of patient and experienced “good” or “bad” versions of the same scripted healthcare consultation, with only changes in delivery and engagement.
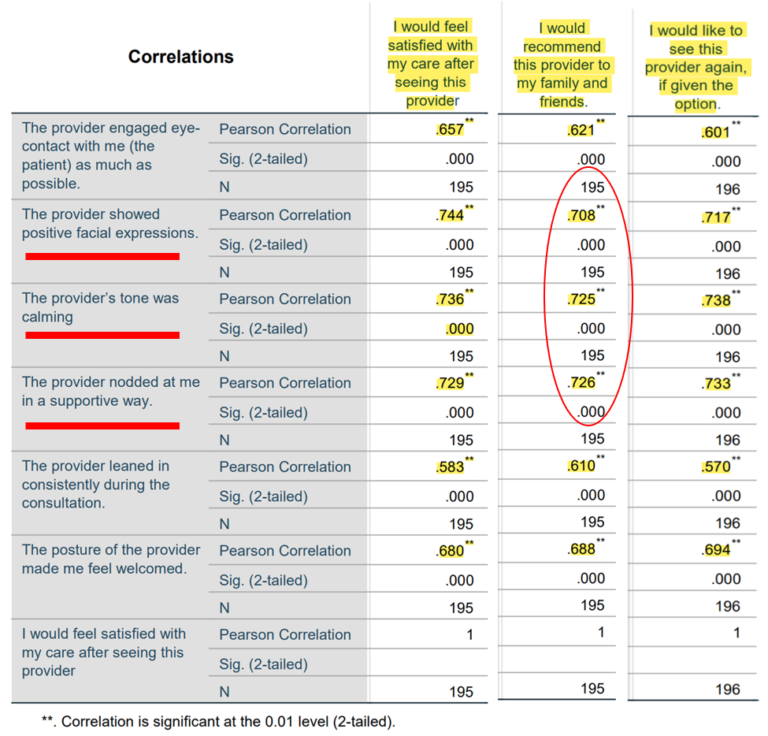
As you can see by the results presented here, we found strong correlation between behaviors like positive facial expressions, calming tone and head nods in whether the “patient” would recommend the provider to others.
In addition, we surprisingly found evidence that many patients who watched the “bad” version of care delivery expressed neutral or even positive experiences because their expectations were so low. This means positive changes to provider engagement will not only improve patient experience, but likely patient health through better compliance with provider advice.